
How to Turn Your Website Into a High-Converting Sales Machine
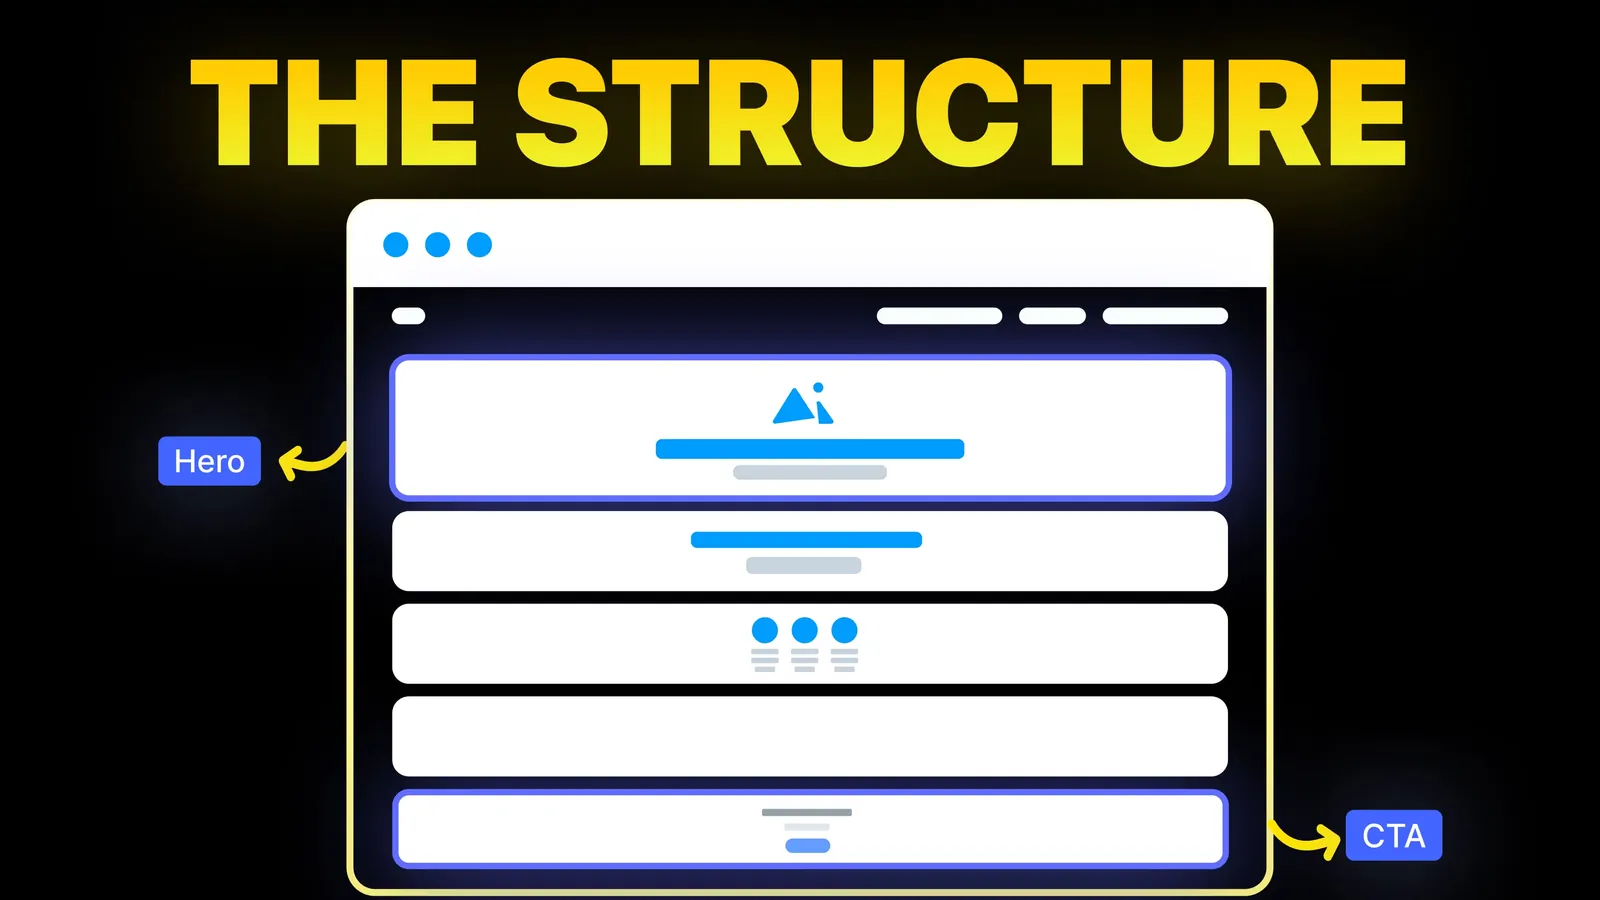
The structure behind a website that sells: the five decisions that carry conversion, the homepage section order, and how to rebuild without losing traffic.
Web Design
Pasting a web address into a speed test takes ten seconds. Knowing what the number means takes longer. We ran our own home page through PageSpeed Insights five times on 3 November 2026 and got five different results, with nothing changed between runs. This guide shows those results, explains which tool answers which question, and gives you a simple way to test that will not send you chasing noise.

To test your website speed, open PageSpeed Insights, paste the full address of the page, and run it. Read the top section first: if it shows real user data, that is your answer. If it says there is not enough data, run the test three times and take the middle score. Then look at the specific metrics below the score and the suggested fixes.
Once you know what is slow, our guide to website speed optimization for small sites gives the fixes in order. This post only covers the testing.
On 3 November 2026 we searched Google (United States, English) for "website speed test" and "how to test website speed". Nearly every result is a tool: Pingdom, PageSpeed Insights, GTmetrix, WebPageTest, Uptrends, KeyCDN, Calibre, plus a Cloudflare explainer and a Webflow list.
The roundups list tools and features. Rank Math's list, for example, advises testing more than once, yet it does not name a test page or show results to back that up. None of the pages we read shows one page tested repeatedly, so a reader cannot see how much the score moves by itself. A popular comment in an r/TechSEO thread shown in the results made a similar point: decide what to fix from the waterfall and diagnostics, not the composite score.
So we measured it.
The page was the amariq.com home page, tested on 3 November 2026 at about 11:20 Bangladesh time. PageSpeed Insights ran Lighthouse 13.6.0 for each result. We added a harmless query string to the address for each new run, so that the tool produced a new analysis rather than showing a recent one.
| Run | Device | Score | First paint (FCP) | Largest paint (LCP) | Blocking time (TBT) | Layout shift (CLS) | Speed Index |
|---|---|---|---|---|---|---|---|
| 1 | Mobile | 97 | 1.2 s | 1.2 s | 70 ms | 0 | 4.6 s |
| 2 | Mobile | 98 | 1.0 s | 1.0 s | 130 ms | 0 | 3.2 s |
| 3 | Mobile | 100 | 1.0 s | 1.0 s | 80 ms | 0 | 1.7 s |
| 4 | Desktop | 82 | 0.4 s | 0.4 s | 400 ms | 0.005 | 1.1 s |
| 5 | Desktop | 93 | 0.3 s | 0.3 s | 210 ms | 0 | 0.8 s |
Five runs on one page is a small sample, and it is a snapshot of our own site, not a benchmark. Still, it teaches four things.
Google's PageSpeed Insights documentation expects this. It blames run-to-run change on local network availability, client hardware availability and client resource contention.
This is the idea that makes every speed test easier to read.
They can disagree. web.dev's article on lab and field differences lists reasons: visitors arrive with cached files, screens of different sizes change which element counts as largest, and lab layout shift covers only the load, while real visitors keep scrolling. It says to set priorities from field data, and to use lab data to look for gains for visitors on slower networks and older phones.
A good lab score does not guarantee a good real experience either. Google's documentation says so directly, and it treats any score of 90 or more as good.
From the same Google documentation, read on 3 November 2026. These apply to real user data. The first three are the Core Web Vitals, and the Search Console report uses the same ranges for them.
| Metric | Good | Needs improvement | Poor |
|---|---|---|---|
| LCP (largest item appears) | Up to 2.5 s | Up to 4 s | Over 4 s |
| INP (response to a tap or click) | Up to 200 ms | Up to 500 ms | Over 500 ms |
| CLS (layout jumping) | Up to 0.1 | Up to 0.25 | Over 0.25 |
| FCP (first content appears) | Up to 1.8 s | Up to 3 s | Over 3 s |
| TTFB (server's first response, experimental) | Up to 800 ms | Up to 1.8 s | Over 1.8 s |
The lab score has its own scale: 90 or above is good, 50 to 89 needs improvement, and below 50 is poor. Lab tests cannot measure INP because nobody is tapping, so they report Total Blocking Time as a stand-in. Our run shows why that matters: a blocking time of 400 ms says the page was busy during that simulated load, and it does not tell you how real taps went.
We ran only PageSpeed Insights for this post. The rest of the table comes from each maker's own page, read on 3 November 2026, not from our testing.
| Tool | Best for | What its page states |
|---|---|---|
| PageSpeed Insights | Your first test, and real user data | Lab and field data, mobile and desktop, no account |
| Core Web Vitals report | Your whole site over time | Real user data grouped by similar pages. Only indexed URLs appear |
| Lighthouse in Chrome | Testing a page from your own computer | Named by Google's report as an in-browser test |
| GTmetrix | A waterfall of every file, and other regions | Lighthouse-based reports, CrUX data, defaults to Seattle on an unthrottled connection |
| Pingdom | A quick look at which files are large or slow | Chart of each request by DNS, connect, wait and receive stages, with a choice of test location |
| WebPageTest | Deep diagnosis across browsers and devices | A limited free view, with more after you create an account. The site notes a new home with LogicMonitor |
| Cloudflare's guide | Understanding the terms | Explains load time, TTFB, requests, render-blocking and round trips |
Two details to watch. GTmetrix's default of an unthrottled connection is far kinder than a phone on mobile data, so do not compare its number with a PageSpeed mobile result. And its home page gives both 25 and 28 as its count of test regions, so check the list if a certain city matters to you.
The documentation can lag as well. Google's page says Lighthouse simulates a Moto G4, while the report we got on 3 November 2026 named an emulated Moto G Power on slow 4G. Trust the report's own environment notes, which also show the date of the test.
You can also run our free website audit, which includes a speed reading along with other checks, and turn the results into a plan with the small business audit checklist.
Check these before you pay for speed work.
On the other hand, slow pages on every template, with poor field data, can point to the build or the hosting rather than one large image. Our notes on hosting costs can help you judge whether a move would be worth it.
If your results point to images, scripts, fonts or a heavy template, we can fix the cause on Webflow, Framer, WordPress, Shopify, Wix, Squarespace or a custom build. We quote from the scope, never by the hour, with 40% to start, 30% at design approval and 30% before launch. See our website optimization service.
For most owners, PageSpeed Insights, because it is free, needs no account and is the one place that combines lab results with Google's real user data. Add GTmetrix, Pingdom or WebPageTest when you want a detailed file-by-file view.
Google counts 90 or above as good, 50 to 89 as needing improvement and below 50 as poor. A good score does not guarantee a good experience for real visitors, so check LCP, INP and CLS field data as well, when you have it.
Network conditions and the state of the test machine change between runs. Our own home page moved from 82 to 93 on desktop with no edit. Run several tests and use the middle one, rather than reacting to a single number.
It can happen, as it did for us. Our desktop runs had higher blocking time than our mobile runs. Treat the two scores as separate tests and look at which metric is pulling the score down.
The page or the site does not have enough visits from Chrome users in the dataset, or it has only just gone live. PageSpeed Insights falls back to the whole-site figure when it can. Otherwise, rely on repeated lab tests.
Lab tests change at once. Field data covers a trailing 28 days, so it improves gradually over about four weeks. The Search Console validation works on the same 28-day period.
The pages people land on most, which you can find in your analytics or the Search Console Performance report. Test one page of each template rather than only the home page, because a clean home page can hide a slow blog or product template.

The structure behind a website that sells: the five decisions that carry conversion, the homepage section order, and how to rebuild without losing traffic.

Mobile website design fixes in priority order, with the real tap target sizes from W3C, Apple and Google, and how to test now Google's mobile tool has gone.

How to make a product demo video: where it goes on a SaaS site, how to record it on a Mac, which recorder to pick and how to add it without slowing the page.