
How to Turn Your Website Into a High-Converting Sales Tool
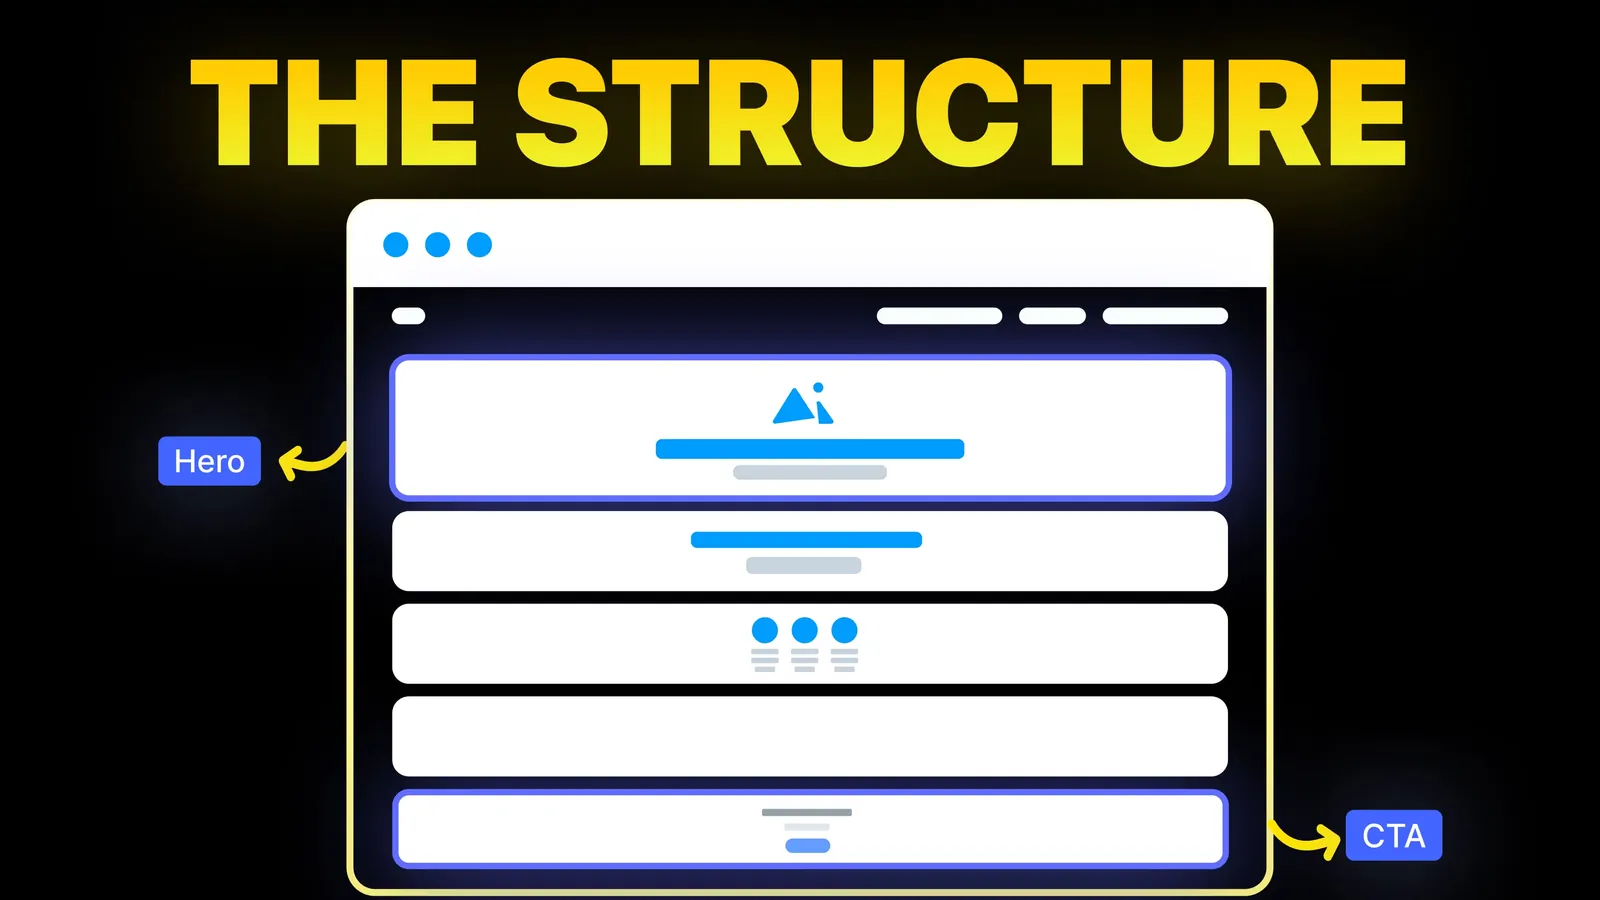
The structure behind a website that sells: the five decisions that carry conversion, the homepage section order, and how to rebuild without losing traffic.
SEO
Most pages on this topic are reference documents or tool pitches. They list the three scores and the targets, then leave you to guess what to do. This guide turns each score into something a visitor feels, names what is usually behind it, and says who on your team can fix it, using Google and web.dev pages read on 12 November 2026.

Core Web Vitals are three measurements Google publishes to describe how a page feels to use: Largest Contentful Paint (LCP) for how soon the main content shows, Interaction to Next Paint (INP) for how fast the page responds when you tap or click, and Cumulative Layout Shift (CLS) for how much the page moves while you read it. A page is "good" when LCP is 2.5 seconds or less, INP is 200 milliseconds or less and CLS is 0.1 or less, for at least three in four visits. If one is failing, the table below shows what to look for.
Who is writing: we are Amariq, a web design studio. The definitions and numbers are from web.dev and Google's own pages, read on 12 November 2026.
On 12 November 2026, Google (US, English) showed an AI Overview, Google's Search Central explainer, Search Console help, web.dev's learning pages, Cloudflare, Semrush (19 March 2024), Backlinko (26 October 2026) and Ahrefs (5 January 2025). They define the metrics well. They tend to stop at "optimise your images" and "reduce JavaScript". What a business owner needs is a map from the symptom they notice to the cause and to the person who can fix it, plus a way to read the report in Search Console. That is below.
| Score | What it is | What a visitor feels | Good | Poor |
|---|---|---|---|---|
| LCP, Largest Contentful Paint | When the biggest visible item has appeared | "Is this page loading?" | 2.5 seconds or less | Over 4 seconds |
| INP, Interaction to Next Paint | The delay between a click, tap or key press and the page reacting | "Did it hear me?" | 200 milliseconds or less | Over 500 milliseconds |
| CLS, Cumulative Layout Shift | How far things jump around while the page is in use | "I tapped the wrong button" | 0.1 or less | Over 0.25 |
Between good and poor sits "needs improvement". Google measures each at the 75th percentile of page loads, which means that three out of four visits must be at or better than the target, with mobile and desktop reported separately.
web.dev says LCP is the render time of the largest image, text block or video visible in the viewport, measured from when the visitor first navigated to the page. Elements that count include images, a video's poster image, an element with a CSS background image and blocks of text. On many business sites that is the hero photo or the main headline.
INP looks at the clicks, taps and key presses across the whole visit and reports the slowest one, ignoring outliers. Scrolling, hovering and zooming are not counted. It replaced First Input Delay, which only measured the first interaction. web.dev says slow responses usually happen because the browser is busy, often with heavy JavaScript, when the visitor acts, or because the code that responds takes too long.
CLS is the largest burst of unexpected layout shifts over the page's life. web.dev lists the common causes as images or videos without known dimensions, web fonts that render larger or smaller than their fallback, third-party ads or widgets that resize themselves, and content added above something already on screen. Shifts within half a second of a tap or click do not count.
web.dev's guide to optimising LCP splits it into four parts and suggests a rough share of the time budget for each. It calls the shares guidelines, not strict rules. On a 2.5 second target they work out like this:
| Part | Suggested share | Of 2.5 seconds | What it means | Main fixes, per web.dev |
|---|---|---|---|---|
| Time to first byte | About 40% | About 1 second | How long the server takes to start answering | Cut redirects, keep caching effective, speed up the server |
| Load delay | Under 10% | Under 0.25 seconds | How long before the browser starts fetching the main image | Make the image visible in the page's HTML, never lazy-load it, set its fetch priority to high |
| Load duration | About 40% | About 1 second | How long the image takes to download | Smaller files, modern formats, a CDN, caching |
| Render delay | Under 10% | Under 0.25 seconds | The gap between downloading and showing it | Reduce render-blocking CSS and scripts, avoid hiding the element while scripts load |
For a typical brochure site the quickest wins are in the middle two rows: an oversized hero image that is lazy-loaded, or one served in an old format.
| What you notice | Likely score | Usual cause, from the web.dev pages | Who fixes it |
|---|---|---|---|
| The big photo at the top takes ages to show | LCP | A large file, a lazy-loaded hero, slow server response | Whoever manages images and the build |
| The page seems stuck for a second after you tap the menu | INP | Heavy JavaScript running at the same moment | A developer, or removing an add-on |
| Text jumps down when an image appears | CLS | Images without set width and height | The person editing the page or the template |
| A banner or chat widget pushes the page when it loads | CLS | Third-party content that resizes itself | Whoever added the widget; reserve space for it or remove it |
| The headline changes size when the font loads | CLS | A web font that differs from its fallback | A developer |
| Everything is slow only on your phone | All three | Mobile and desktop are scored separately; phones can be slower | Test on a phone, then work down the list above |
Which of these you can fix yourself depends on how the site is built. On a hosted builder you usually control images, add-ons and page content, while the server is the platform's job. On a custom or WordPress build, a developer can reach all of it.
Google's Search Console Core Web Vitals report works like this, from its help page read on 12 November 2026:
So a quiet small site may see no data at all. In that case, use a lab test for individual pages and treat the results as a guide; our guide to testing website speed explains why lab and field numbers differ and walks through five runs on one page. For the fixes themselves, see our website speed optimisation guide.
Google's Core Web Vitals page says good scores align with what its core ranking systems seek to reward, alongside other page experience aspects. It does not say how they are weighted, and it does not say a good score guarantees a top position. Google recommends good scores for success in Search and for a good experience in general. Treat them as one input, not the main one: a fast page with nothing useful on it will not outrank a useful one. Our guide on why your site is not showing on Google covers the more common causes first.
| Check | Done? |
|---|---|
| I know which of the three scores is failing, on mobile and on desktop | |
| The main image at the top is sized to its space and not lazy-loaded | |
| Images and videos have set width and height | |
| No widget or banner pushes the page after it loads | |
| Scripts and add-ons I do not use are removed | |
| Fonts are limited to those the design needs | |
| I rechecked after the fix, using field data if there is enough |
Design choices that affect these scores, such as how many animations a page runs, are covered in our guides to website animations and mobile design.
We check all three scores on a phone before a site launches and fix what fails. Quotes come from the scope, never the clock, and the work is yours on final payment. See our web design service.
Three measures of page experience: Largest Contentful Paint for loading, Interaction to Next Paint for responsiveness and Cumulative Layout Shift for visual stability.
LCP of 2.5 seconds or less, INP of 200 milliseconds or less and CLS of 0.1 or less, measured at the 75th percentile of page loads, for mobile and desktop separately.
INP. First Input Delay measured only the delay of the first interaction; INP covers the clicks, taps and key presses across the whole visit and reports the slowest, ignoring outliers.
The report needs enough real-visitor data. New sites can take a few days to show anything, and a small site may not have enough traffic. Google says it falls back to a whole-site group, and shows nothing if that has too little data too.
Google says good scores align with what its ranking systems reward, but does not say how much weight they carry and does not promise a higher position.
Often some of it: resizing images, giving them dimensions, removing add-ons you do not use. Server speed and code usually need the platform or a developer.
The report uses real visitors, with mobile and desktop scored separately. Visitors can have slower phones and connections than your own device.

The structure behind a website that sells: the five decisions that carry conversion, the homepage section order, and how to rebuild without losing traffic.

Mobile website design fixes in priority order, with the real tap target sizes from W3C, Apple and Google, and how to test now Google's mobile tool has gone.

How to make a product demo video: where it goes on a SaaS site, how to record it on a Mac, which recorder to pick and how to add it without slowing the page.